Web page performance has always been a concern of major Internet companies, and for good reason: the research shows that web page performance is a crucial metric in user retention, which makes performance measurement equally important.
Problems with measuring web performance
Can’t be run locally
When web performance testing tools can be run locally, developers can find problems earlier and solve them much faster. This helps them find issues before running on the shared CI server. Shift-left testing of web performance will also improve the delivery quality.
Inability to continuously measure performance
Most web performance measurement products on the market are SaaS (Software as a Service) products (such as treo). With these products, we can only get a visual result page after running the performance test, we can’t continuously record web page performance improvements or quantify web product performance history well.
Cost
While there are many open source free web performance testing tools, they are not easy to use for some features. Commercial packages such as Sematext and Pingdom are often more feature complete, but they can be expensive. We find Lighthouse CI to be a good balance between the two options.
Difficulty with CI integration
Many tools, which either cannot be run locally or are SaaS products don’t integrate well with automated pipeline tools, have long feedback cycles and low engineering efficiency.
Lighthouse
“Lighthouse is an open-source, automated tool for improving the quality of web pages.
You can run Lighthouse in Chrome DevTools, from the command line, or as a Node module. You give Lighthouse a URL to audit, and then it generates a report on how well the page did. From there, use the failing audits as indicators on how to improve the page. You can also use Lighthouse CI to prevent regressions on your sites."
As the results of my Powerboard audit show, Lighthouse is very easy to use.
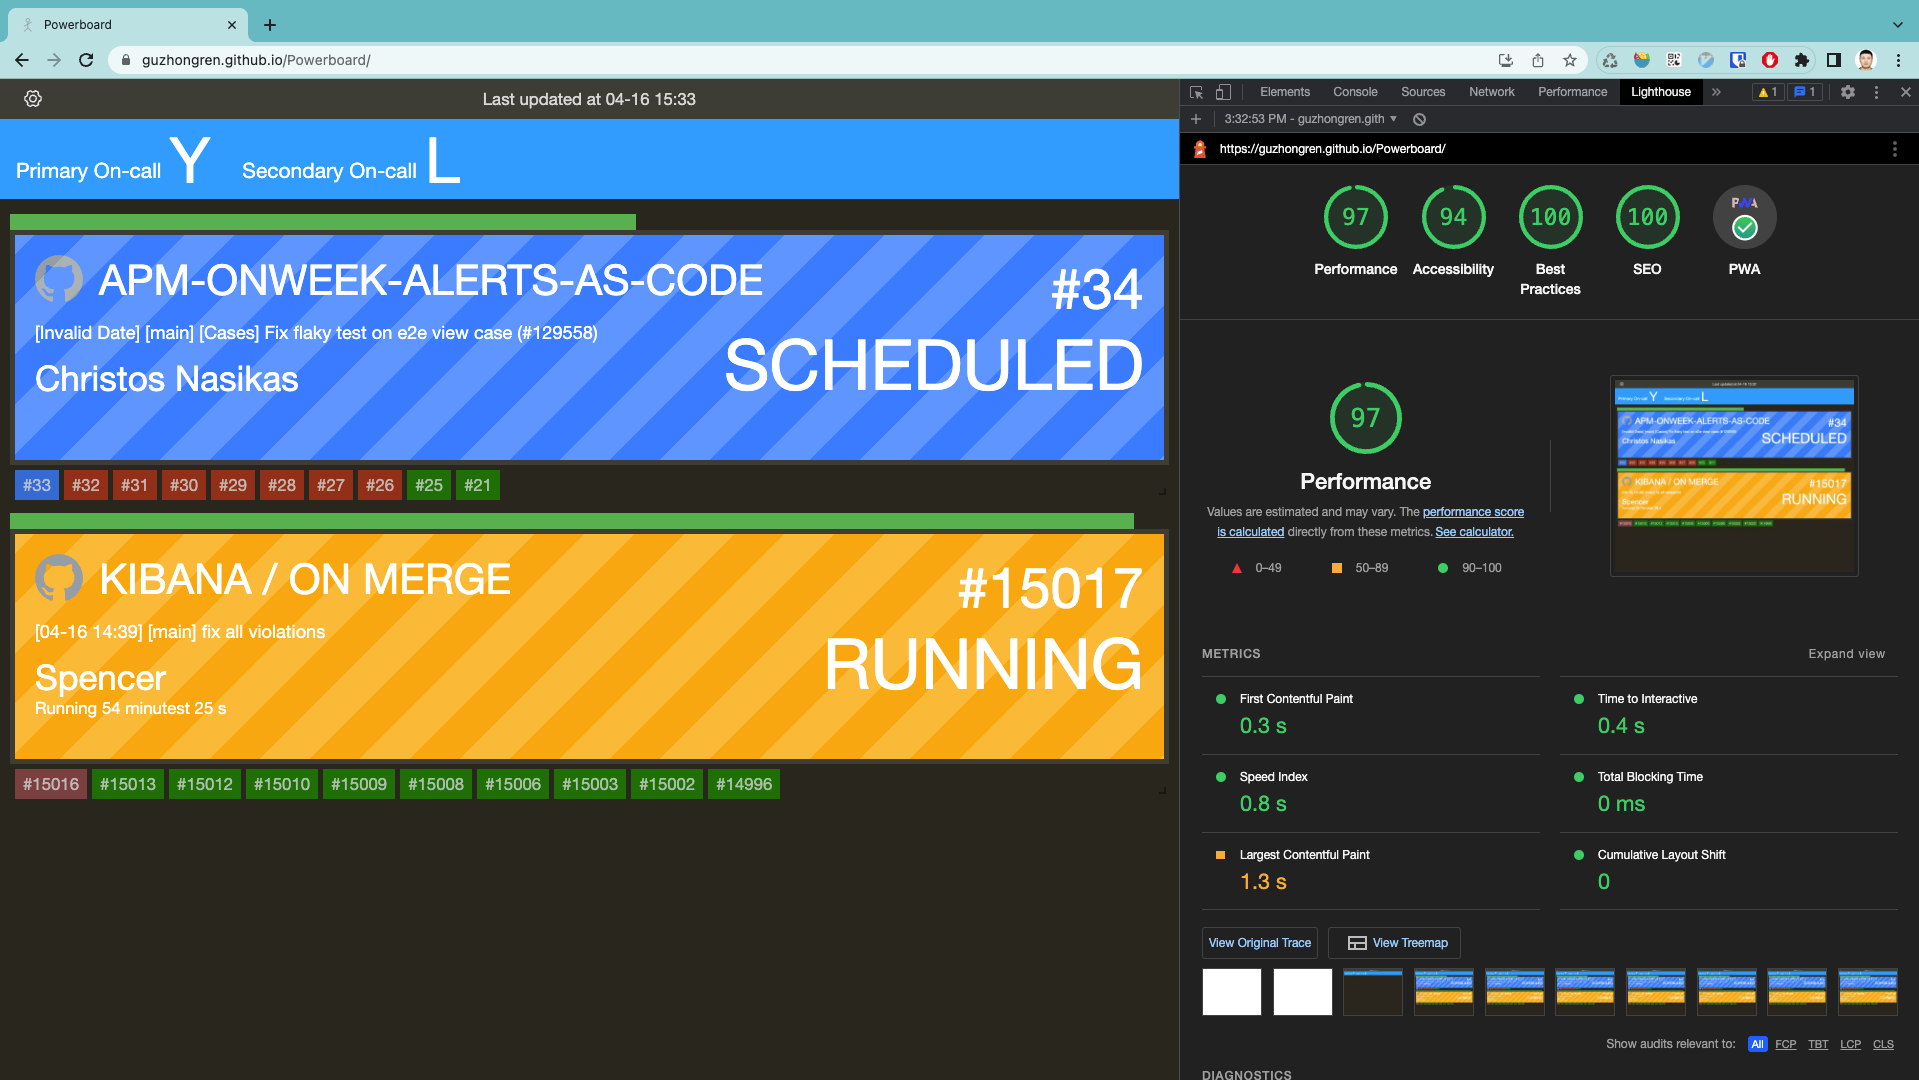

Lighthouse-Chrome-DevTools
Uses of Lighthouse CI and Lighthouse Server
Lighthouse CI
LHCI (Lighthouse CI) is a suite of tools that makes continuously running, saving, retrieving and asserting against Lighthouse results very easy.
How to use
LHCI provides the npm installation package, which can be well integrated in the Pipeline. Just run the autorun command in the corresponding directory:
npm install -g @lhci/cli
lhci autorun
After the operation is completed, LHCI will store the results in the .lighthouseci directory.
Lighthouse Server
The LHCI server saves historical Lighthouse data, displays trends in a dashboard, and offers an in-depth build comparison UI to show differences between builds.
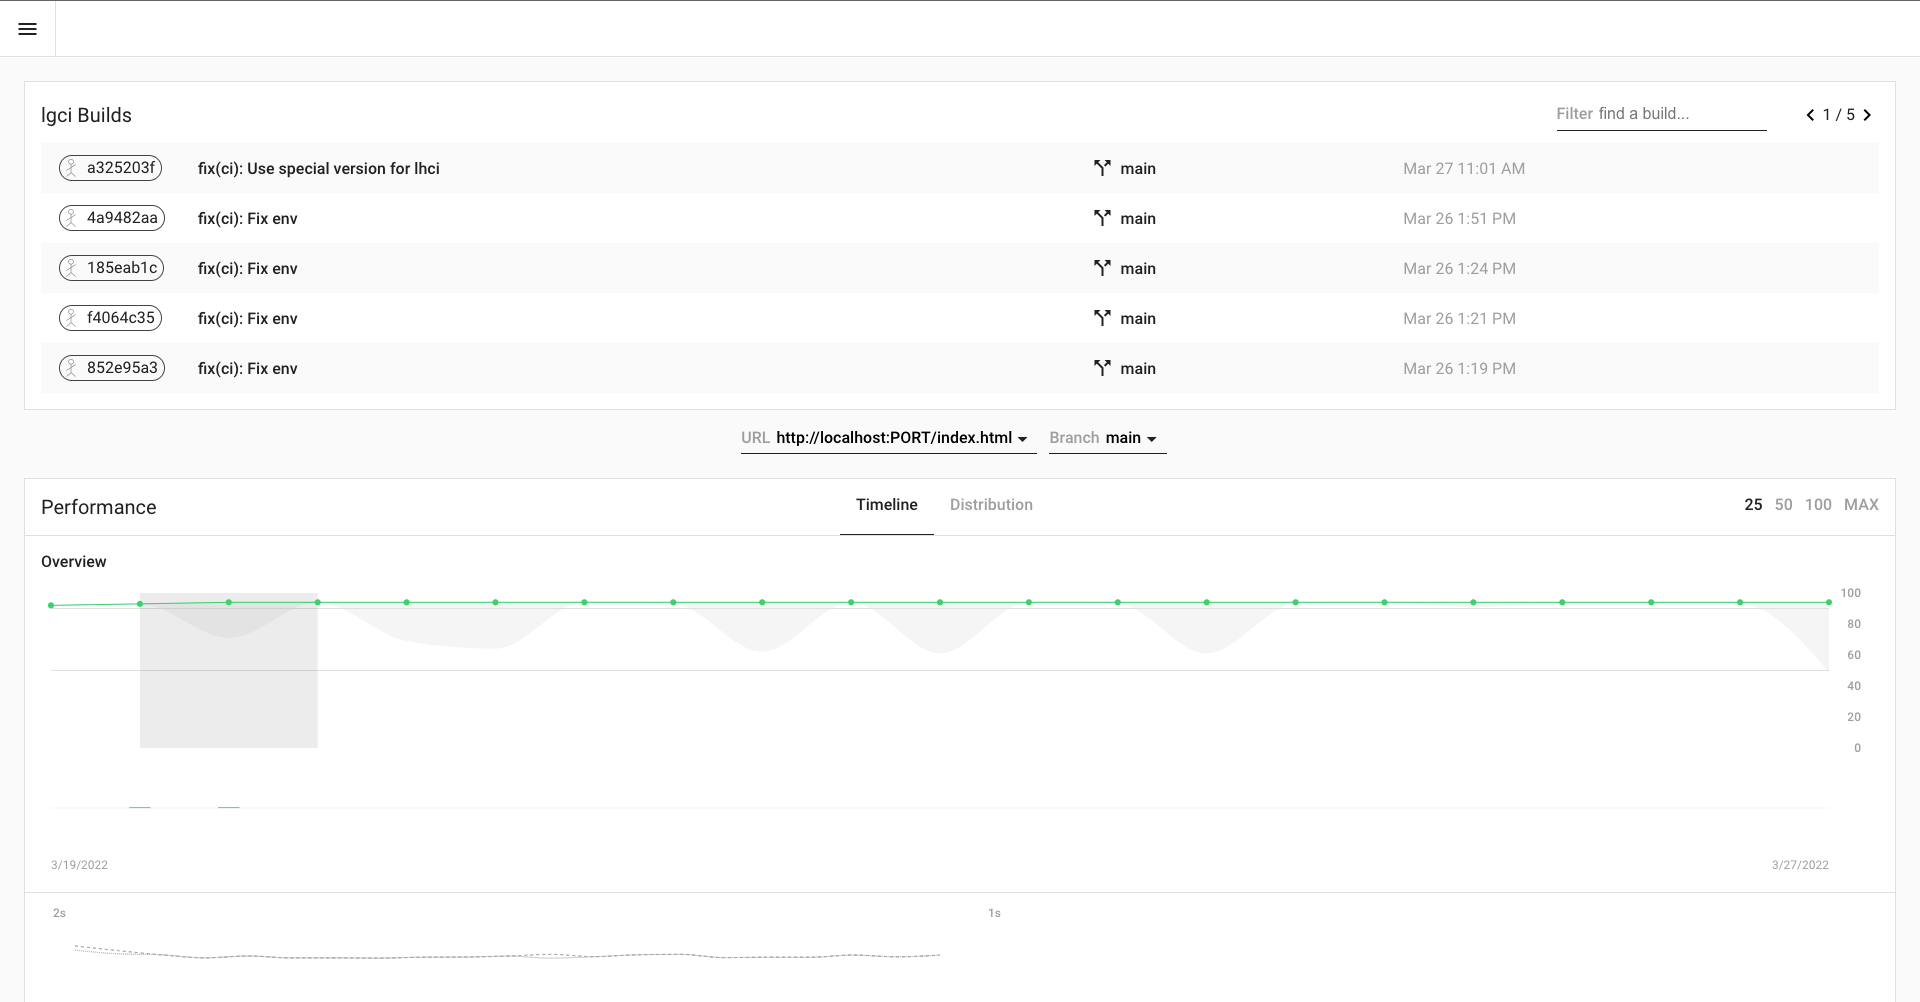

LHCI server
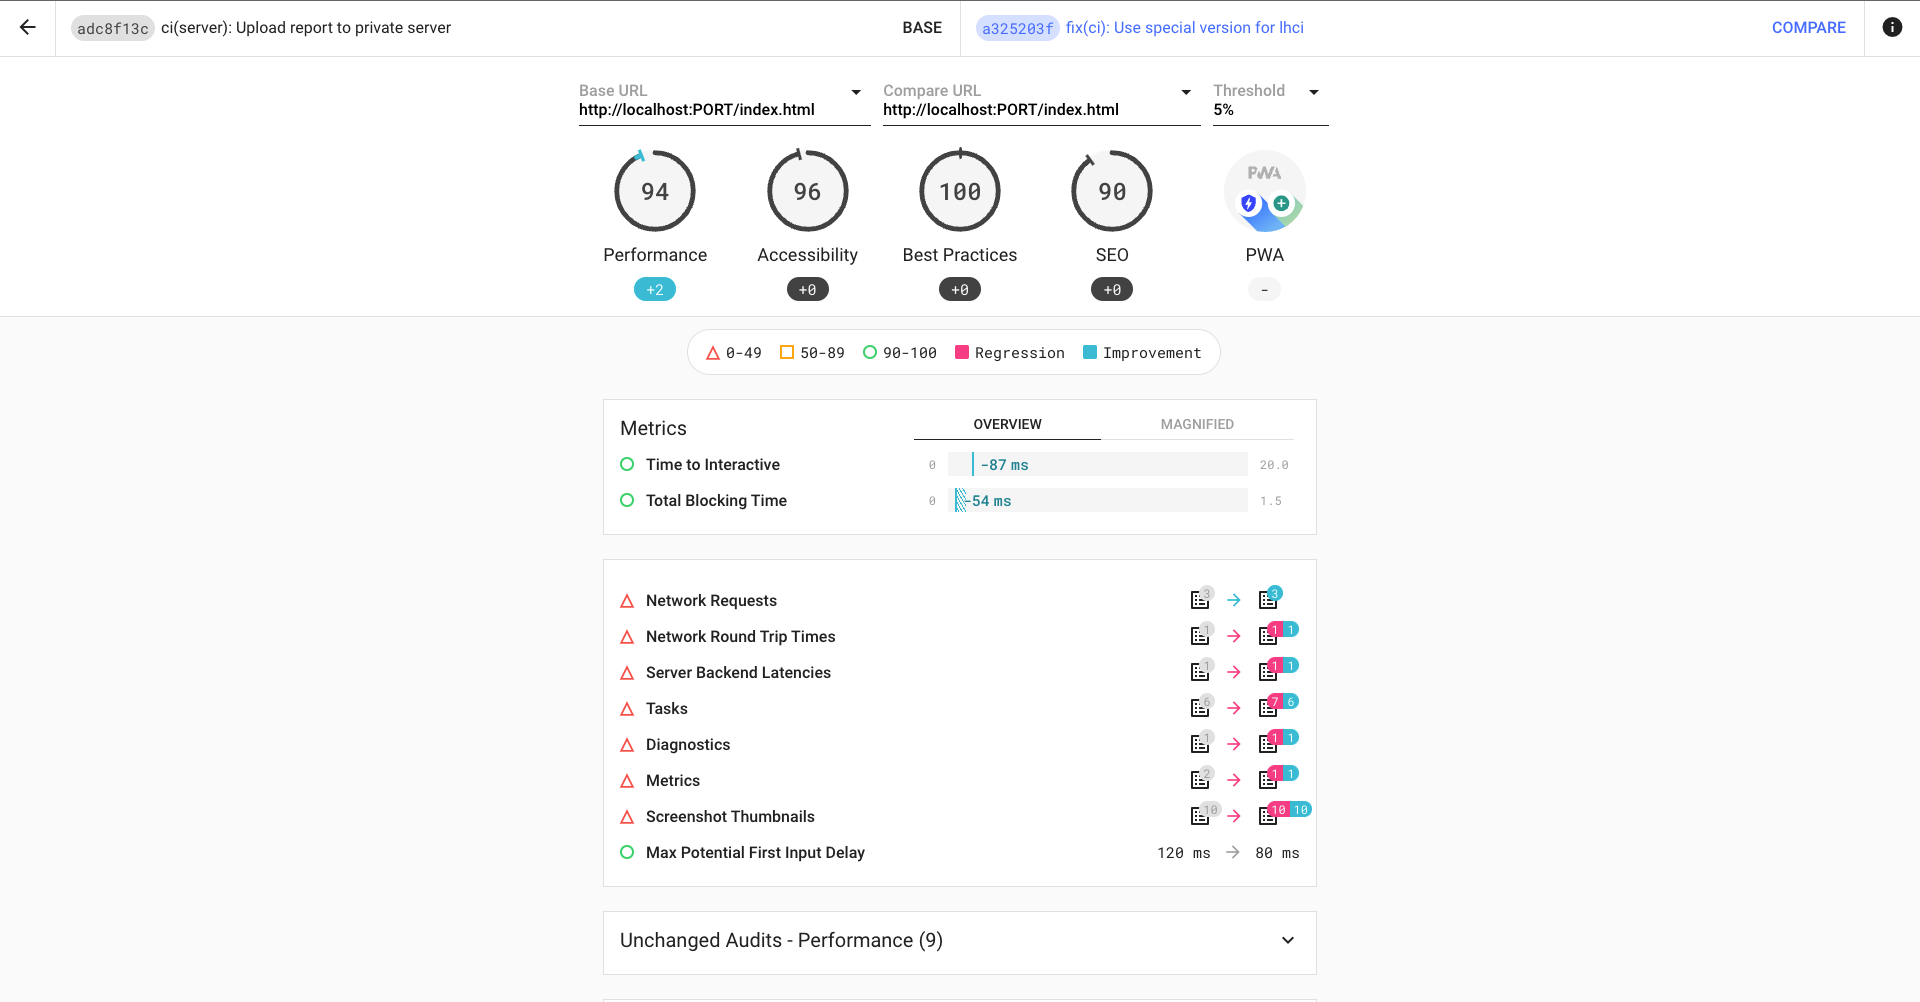

LHCI server comparison
Installation and use of LHCI Server
Using Docker is the best way to install LHCI Server. First, you need to create a Lighthouse App by running the lhci wizard in the container and fill in the corresponding information, then record the generated Build token and Admin token.
Integration with LHCI and Lighthouse Server
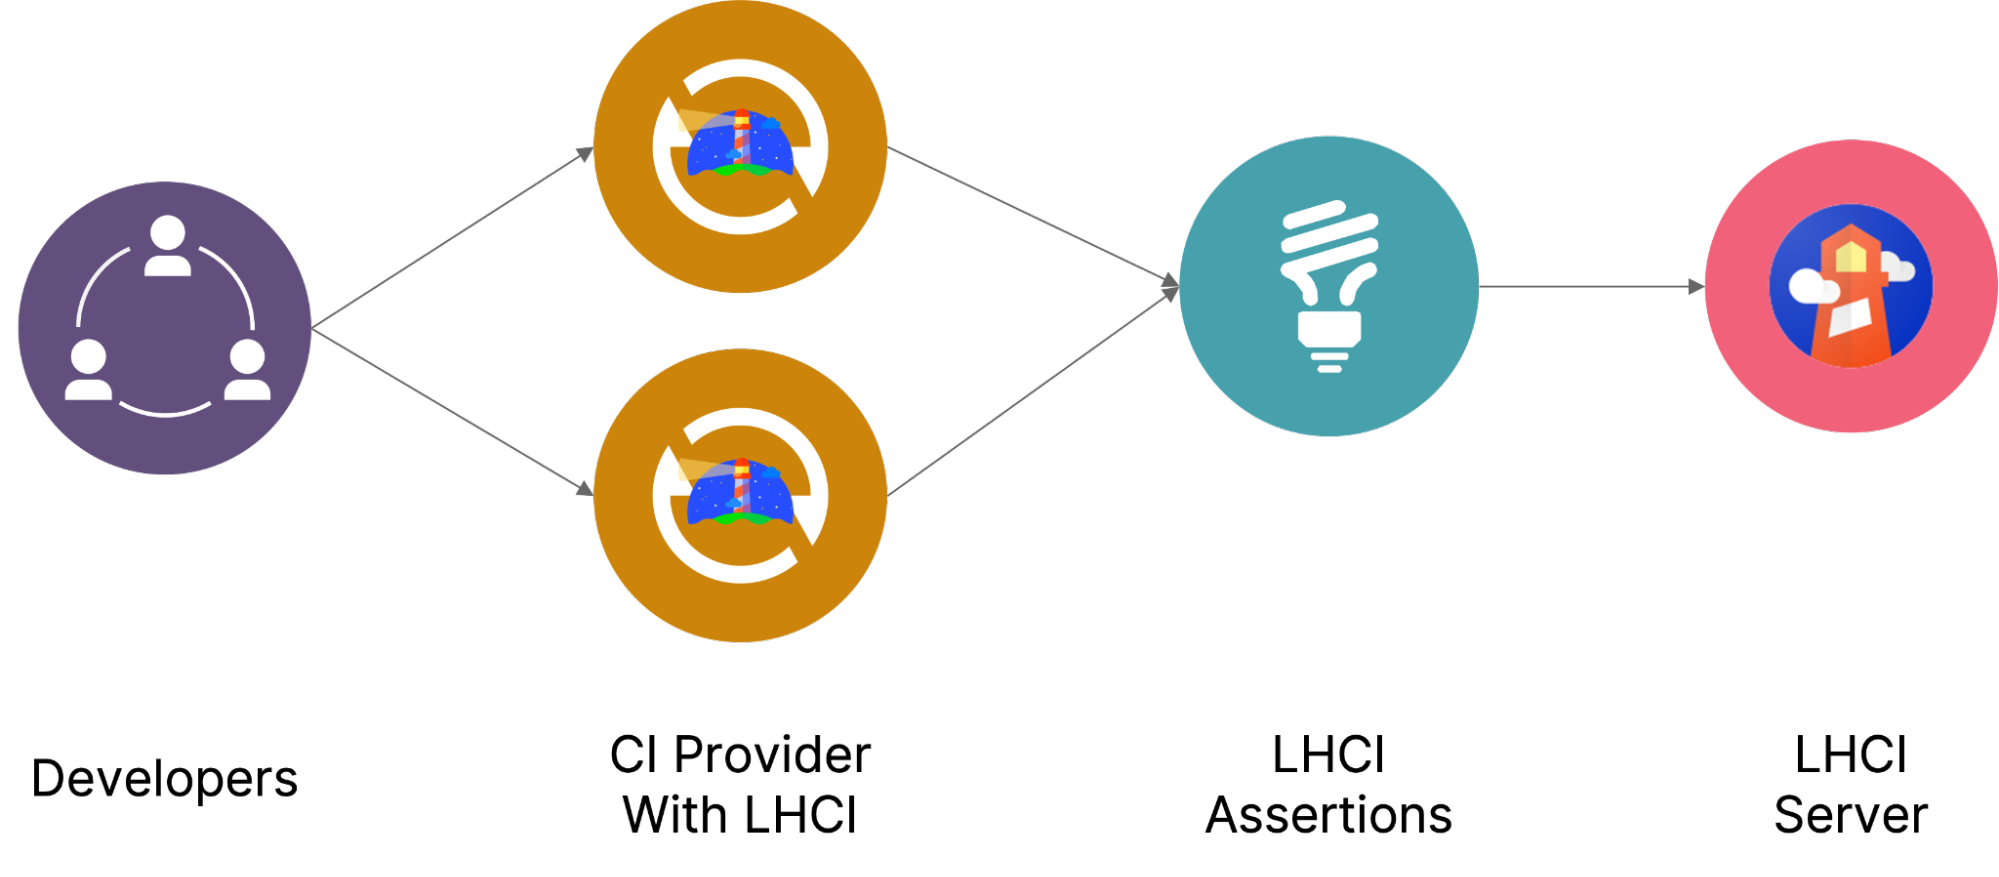

- After installing lhci and lhci server, the next step is to use the two together. We can use GitHub Actions as an example.
- Build GitHub workflow. (See Powerboard.)
.github/workflows/Lighthouse.yml
name: Lighthouse CI
on:
 push:
   branches:
     - main
jobs:
 lhci:
   name: Lighthouse
   runs-on: ubuntu-latest
   steps:
     - uses: actions/checkout@v2
       with:
         ref: ${{ github.event.pull_request.head.sha }}
     - name: Use Node.js 10.x
       uses: actions/setup-node@v1
       with:
         node-version: 16.14.2
     - name: npm install, build
       run: |
         npm install
         npm run build
     - name: Upload Lighthouse Report
       run: |
         npm install -g @lhci/cli
         lhci autorun --config=.github/config/lighthouserc-no-condition.json
         lhci upload --serverBaseUrl=${{ secrets.LHCI_SERVER_URL }} --token=${{ secrets.LHCI_BUILD_TOKEN }}
       env:
         LHCI_GITHUB_APP_TOKEN: ${{ secrets.LHCI_GITHUB_APP_TOKEN }}
     - name: Check Lighthouse Report
       run: |
         lhci autorun --config=.github/config/lighthouserc.json
.github/config/lighthouserc-no-condition.json
 "ci": {
   "collect": {
     "staticDistDir": "./dist",
     "settings": {
       "formFactor": "desktop",
       "screenEmulation": {
         "mobile": false,
         "width": 1920,
         "height": 1080,
         "deviceScaleFactor": 1,
         "disabled": false
       }
     }
   },
   "assert": {
     "assertions": {
       "categories:performance": "off",
       "categories:accessibility": "off",
       "categories:best-practices": "off",
       "categories:seo": "off",
       "categories:pwa": "off"
     }
   }
 }
}
.github/config/lighthouserc.json
 "ci": {
   "collect": {
     "staticDistDir": "./dist",
     "settings": {
       "formFactor": "desktop",
       "screenEmulation": {
         "mobile": false,
         "width": 1920,
         "height": 1080,
         "deviceScaleFactor": 1,
         "disabled": false
       }
     }
   },
   "assert": {
     "assertions": {
       "categories:performance": ["error", { "minScore": 0.8 }],
       "categories:accessibility": ["error", { "minScore": 0.95 }],
       "categories:best-practices": ["error", { "minScore": 1 }],
       "categories:seo": ["error", { "minScore": 0.9 }],
       "categories:pwa": ["warn", { "minScore": 0.99 }]
     }
   }
 }
}
- Need to store the Build token generated by lhci Server and the address of lhci Server in the Secrets of the GitHub project.
- The lhci command is executed twice. Because lhci autorun runs the default assertion, the purpose of using the command without assertion for the first time is to upload the current web page performance server side; the second time, you configure various indicator thresholds, if they don’t meet the requirements, the Pipeline will be blocked.
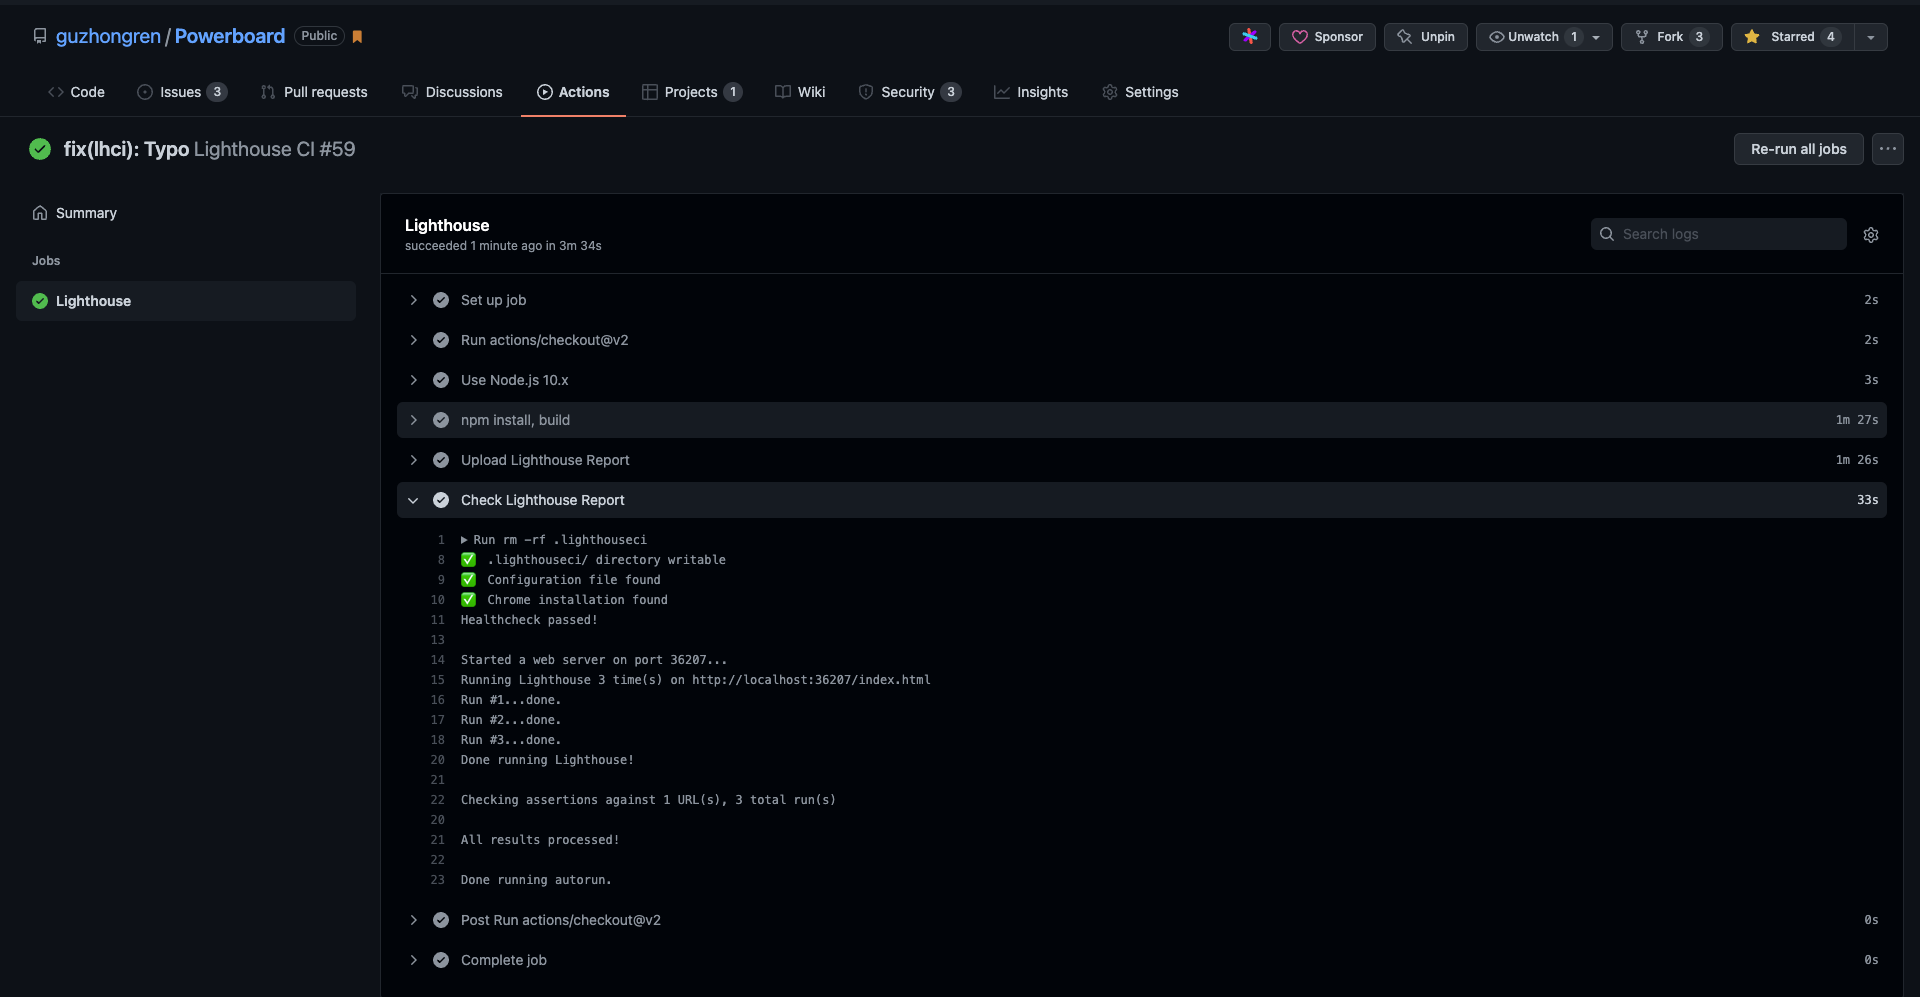

Powerboard lighthouse actions
LHCI is an efficient set of free, open-source and easy to integrate tools that can evaluate web applications and pages, therefore helping to improve user conversion rates and the company’s profits.
Disclaimer: The statements and opinions expressed in this article are those of the author(s) and do not necessarily reflect the positions of Thoughtworks.


